You are not logged in.
- Topics: Active | Unanswered
#101 2009-07-05 20:41:32
- Trent
- Member
- From: Baltimore, MD (US)
- Registered: 2009-04-16
- Posts: 990
Re: pacgraph: Visualize your system
Plain old 'file' will give the geometry of PNG images as well.
Offline
#102 2009-07-17 21:08:49
- keenerd
- Package Maintainer (PM)
- Registered: 2007-02-22
- Posts: 647
- Website
Re: pacgraph: Visualize your system
A very kind fellow (Carl Hamann) has emailed me a few patches for Pacgraph. He fixed up glitches in the Debian loader and added support for RPM. I can give these a quick test with live cds, but more people testing these new modes with actual installs would be great.
Both modes are kind of slow. Where arch mode loads files, these parse the output of dpkg or rpm. I've been hacking on less indirect loaders, but ugh. I did not know how simple we Archers have it.
The code for Debian/Ubuntu/Redhat/Fedora support is on http://github.com/keenerd/pacgraph
Last edited by keenerd (2009-07-17 21:09:11)
Offline
#103 2009-07-22 17:50:56
- 9nqksfhn
- Member
- Registered: 2009-07-22
- Posts: 28
Re: pacgraph: Visualize your system
Sometimes this shows the kernel and sometimes it doesn't.
Offline
#104 2009-07-23 12:52:35
- keenerd
- Package Maintainer (PM)
- Registered: 2007-02-22
- Posts: 647
- Website
Re: pacgraph: Visualize your system
Sometimes this shows the kernel and sometimes it doesn't.
Pacgraph uses dependency chain compression to remove redundant information. For example, Opera need Qt. If Opera is the only Qt based app you have, Qt is absorbed into Opera and you will not see Qt in the results. Qt needs sqlite3. If no other app needs sqlite3, then sqlite3 will be absorbed into Opera as well. This way you can see the "true size" of your installed applications, and remove a lot of the visual clutter.
While the layout changes with each run, the actual packages listed should be fairly consistent. Are you adding or removing packages between runs?
Offline
#105 2009-07-23 16:58:27
- 9nqksfhn
- Member
- Registered: 2009-07-22
- Posts: 28
Re: pacgraph: Visualize your system
9nqksfhn wrote:Sometimes this shows the kernel and sometimes it doesn't.
Pacgraph uses dependency chain compression to remove redundant information. For example, Opera need Qt. If Opera is the only Qt based app you have, Qt is absorbed into Opera and you will not see Qt in the results. Qt needs sqlite3. If no other app needs sqlite3, then sqlite3 will be absorbed into Opera as well. This way you can see the "true size" of your installed applications, and remove a lot of the visual clutter.
While the layout changes with each run, the actual packages listed should be fairly consistent. Are you adding or removing packages between runs?
I just ran pacgraph eight times without adding or removing any packages in between, and the packages listed seemed to be the same.
When I type "pacman -Qi kernel26" there is only one package listed which depends on it (graphics card driver), so I must have previously had something else installed that also depended on the kernel, so the kernel was showing, but having removed it the graphics driver is the only package that depends on the kernel so it is no longer shown.
I think it's a bug in the repos; I just typed "pacman -Rsn kernel26 nvidia-96xx", and it said:
checking dependencies...

Remove (3): nvidia-96xx-96.43.11-5  kernel26-2.6.30.2-1
            kernel26-firmware-2.6.30-1

Total Removed Size:   107.16 MB

Do you want to remove these packages? [Y/n]
Had I pressed "Y" then "ENTER" my computer would have broken, because everything depends on the kernel, not just my graphics driver.
Last edited by 9nqksfhn (2009-07-23 17:03:25)
Offline
#106 2009-07-23 18:09:41
- 9nqksfhn
- Member
- Registered: 2009-07-22
- Posts: 28
Re: pacgraph: Visualize your system
Out of interrest why does the layout change every time even when the installed packages are the same?
Offline
#107 2009-07-23 18:38:23
- knopper92
- Member

- From: British Columbia, Canada
- Registered: 2009-05-14
- Posts: 40
Re: pacgraph: Visualize your system
Let me say just one thing:
This rules.
Offline
#108 2009-07-23 21:00:19
- keenerd
- Package Maintainer (PM)
- Registered: 2007-02-22
- Posts: 647
- Website
Re: pacgraph: Visualize your system
knopper, thanks. Spread the word, share some graphs of your system :-)
9nqksfhn, early versions had a bad habit of producing very spindly graphs. Each existing node creates a slight repulsive force, pushing new nodes into open space. Any lopsidedness made a feedback loop of sorts, alternating between two angles 180 degrees apart, causing everything to pile up in one big line. This was not too appealing, and the simplest way to fix it was to add some wiggle to all of the polar coordinates. Eventually this randomness will be removed, or better controlled, because a lot of people want some way of setting output resolution or at least the aspect ratio.
Offline
#109 2009-07-24 10:24:20
- 9nqksfhn
- Member
- Registered: 2009-07-22
- Posts: 28
Re: pacgraph: Visualize your system
Can't you just add an invisible attractive force in the center?
Offline
#110 2009-07-24 13:15:41
- keenerd
- Package Maintainer (PM)
- Registered: 2007-02-22
- Posts: 647
- Website
Re: pacgraph: Visualize your system
There is, in a manner of speaking. It is what keeps most things packed tightly.
The system described was the one is use when randomness was first introduced to the algorithm. It is much more complicated now, with three sources of randomness. I have been crunching through my test data, and it seems like the original wiggle is no longer needed, the other two sources of randomness are enough. Next release, it will probably be gone. Thank you for making things a little simpler.
The various forces on a package are attractive (towards its parent/child nodes) repulsive (away from its sibling nodes) and perpendicular (all other nodes). The current major source of randomness is whether the perpendicular force is applied clockwise or counterclockwise. A random direction is also used for the first/second node of a graph, but is applied so early that it has no predictable effect in the end.
One other clarification, don't think too hard about the use of forces. It is not at all like the traditional forces of physics. Each node looks at its surroundings (using the force calculation only once) and picks the best looking heading. It then travels straight along this heading, looking for an empty space big enough. The required space if larger if more nodes have not yet been placed. Once it does not overlap with anything, it is permanently pinned in place. I am working on a version where the heading curves, but I need to be sure that it will only produce open parabolas.
Because nodes do not move once placed, the order that packages are laid down plays a huge role. I could write another rambling post about this, too. In a nutshell, place the most difficult/central packages first, slip in the no-brainers as you go, and center each node around its largest parent/child.
Offline
#111 2009-08-03 02:12:20
- knopper92
- Member
- From: British Columbia, Canada
- Registered: 2009-05-14
- Posts: 40
Re: pacgraph: Visualize your system
Heres mine, not much installed. Just the way I like it.
Also, I read through your code. Why not just get a list of all the installed packages like this?
import commands

status, pkglist = commands.getoutput("pacman -Qd")
Get what I mean?
Other than that, Thanks for making this, I found it pretty useful.
Last edited by knopper92 (2009-08-03 02:17:10)
Offline
#112 2009-08-03 03:22:11
- dmz
- Member

- From: Sweden
- Registered: 2008-08-27
- Posts: 881
- Website
Re: pacgraph: Visualize your system
Offline
#113 2009-08-10 21:25:52
- keenerd
- Package Maintainer (PM)
- Registered: 2007-02-22
- Posts: 647
- Website
Re: pacgraph: Visualize your system
New update, with just one big feature: highlighting. You can single out one package and color its dependencies and inverse deps uniquely. Also, some tweaks to the layout algorithm.
Also, I read through your code. Why not just get a list of all the installed packages like this?
status, pkglist = commands.getoutput("pacman -Qd")
Two reasons. First, commands is depreciated. Second, the current method (a simple directory listing) works with all repositories, not just local.
dmz, that is a sweet system! I take it you use it for full time programming and hosting teewars on the side?
Offline
#114 2009-08-11 03:02:20
- dmz
- Member
- From: Sweden
- Registered: 2008-08-27
- Posts: 881
- Website
Re: pacgraph: Visualize your system
dmz, that is a sweet system! I take it you use it for full time programming and hosting teewars on the side?
Oops. That was actually the wrong machine... the server. Sorry for that, here's my bloated desktop;
Offline
#115 2009-08-13 04:23:03
- keenerd
- Package Maintainer (PM)
- Registered: 2007-02-22
- Posts: 647
- Website
Re: pacgraph: Visualize your system
There was some interest over in the Crunchbang forums. Here are two shots:
http://farm4.static.flickr.com/3078/381 … 86dd_b.jpg
http://www.zwixy.com/images/818087212pacgraph.png
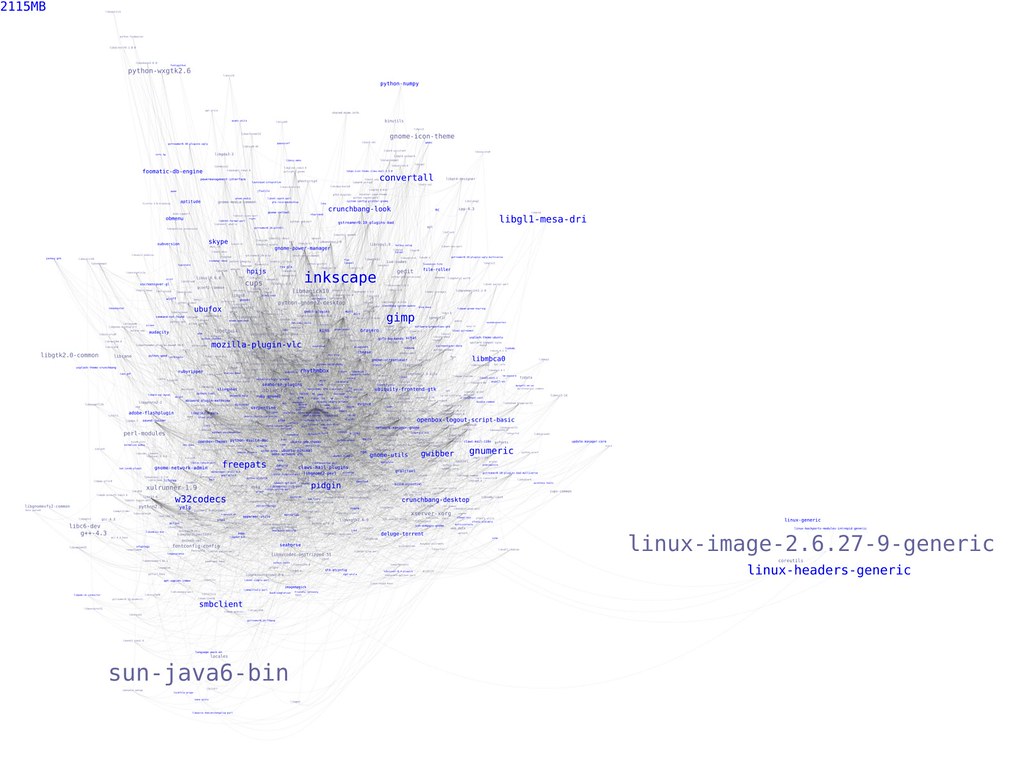
I could not find higher res versions. 2.1 gigs is pretty typical install size for a 700Mb live cd.
Offline
#116 2009-08-16 23:23:04
- OneEyedPimp
- Member
- Registered: 2008-05-02
- Posts: 103
Re: pacgraph: Visualize your system
Here is just an Idea, and I am trying to integrate it now, but this is my first time dealing with python, but how bout random "link" line colors. Like it has like three colors, and when it goes through and assigns a link line, it randomly chooses one of three colors. Looking at the code, it looks like it may be a tricky proposition, but it was just a thought. Great and really cool script by the way. Why did you program it? Just for fun?
Offline
#117 2009-08-17 12:48:03
- keenerd
- Package Maintainer (PM)
- Registered: 2007-02-22
- Posts: 647
- Website
Re: pacgraph: Visualize your system
Glad you enjoy it.
That idea would not be too hard. Right now the links' color is set by wrapping them all in a group. So it is all or nothing. However, the text labels used to be colored by a group, and now they are all individually colored. It might be beneficial to see how the text went from groups to individuals. Pull the code from Github, and look a few weeks ago for "package highlighting". Python's random.choice makes choosing one element from a list pretty simple, too.
That said, I probably would not accept such a patch, unless it looked truly spectacular. Visual randomness has no place in infographics. I do like the idea of varying the link color, but it has to mean something. The simplest would be to make longer lines heavier/darker/opaque. Pie in the sky, link weight would correlate to how dependent packages are on each other, but that would require running the apps in a debugger and profiling the libraries used.
I originally wrote a text-only pacgraph three-ish years ago when I was running Arch on a 1Gb SSD. "pacgraph --console" is very similar. Infographics is one of my day jobs, so I thought it would be fun to make a visual. Turns out Graphviz explodes if you ask it to plot 600 things (let alone every package in the repos!), so pacgraph was born.
Offline
#118 2009-08-17 19:08:35
- OneEyedPimp
- Member
- Registered: 2008-05-02
- Posts: 103
Re: pacgraph: Visualize your system
Thank you keenerd for the info. I really like the script and I will probably just play around with it because I have never really had a chance to program python extensively. *ponders how to make the links mean something* :-)
And thanks for the pointers. Really cool how you were able to program this. A little envious. haha
P.S. This also made me realize how bloated my laptop is with 4 Gigs of packages.
Offline
#119 2009-08-21 20:23:43
- knopper92
- Member
- From: British Columbia, Canada
- Registered: 2009-05-14
- Posts: 40
Re: pacgraph: Visualize your system
knopper92 wrote:Also, I read through your code. Why not just get a list of all the installed packages like this?
status, pkglist = commands.getoutput("pacman -Qd")Two reasons. First, commands is depreciated. Second, the current method (a simple directory listing) works with all repositories, not just local.
Oh, my bad. Didn't realize it was depreciated. Looks like it moved to the subprocess module.
Offline
#120 2009-08-23 19:01:00
- ApotheoZ
- Member
- Registered: 2009-08-10
- Posts: 40
Re: pacgraph: Visualize your system
Simply pretty !
Offline
#121 2009-08-24 00:01:44
- keenerd
- Package Maintainer (PM)
- Registered: 2007-02-22
- Posts: 647
- Website
Re: pacgraph: Visualize your system
New features!
One feature was added by bzklrm. This is "-e/--explicits". Basically, if you have explicitly installed a package, this will force it to show up in the picture. He found it increased the number of nodes drawn by 10%, for his installation.
One new experimental option was added, "-n/--no-compression". Where as "-e" disables chain compression for some packages, this disables it for everything. All packages will be rendered even if they are in a chain, and it almost doubles the number of nodes drawn, for my installation. I am not actually using this for normal pacgraph operations, it is there for some very crazy and silly sets of data.
As always, code can be found on the AUR, github or my website.
Also, looking at the pkgstats info, it seems pacgraph is installed on 14% of Arch systems. Yay!
Last edited by keenerd (2009-08-24 00:13:02)
Offline
#122 2009-08-24 12:10:50
- RagePie
- Member

- From: USA
- Registered: 2009-05-31
- Posts: 51
Re: pacgraph: Visualize your system
I don't know what made me come to this part of the forums today but this tool is simply awesome. Nice work, Sir Keenerd.
Offline
#123 2009-09-07 21:28:20
- keenerd
- Package Maintainer (PM)
- Registered: 2007-02-22
- Posts: 647
- Website
Re: pacgraph: Visualize your system
A little addition for this update. Redditor imalove found optipng can consistently crunch the PNG by at least 25%. For the size of the images this is not insignificant. If optipng is installed, it will run automatically.
If you guys do not like the additional delay for optimizing, I will add a command line switch to disable it.
Offline
#124 2009-09-08 01:54:09
- ugkbunb
- Member

- Registered: 2009-02-26
- Posts: 227
Re: pacgraph: Visualize your system
Bloat ftw!
774 nodes
http://i31.tinypic.com/fqk34.png
Edit: No large images inline - Allan
Last edited by Allan (2009-09-08 02:00:13)
Offline
#125 2009-11-02 21:30:38
- keenerd
- Package Maintainer (PM)
- Registered: 2007-02-22
- Posts: 647
- Website
Re: pacgraph: Visualize your system
Update in AUR. Fixed a bug in the interactive GUI, and added a feature to the GUI. Without args, the gui version (pacgraph-i) just displays your installed packages. With args, it will plot the packages named in the arguments.
Offline