You are not logged in.
- Topics: Active | Unanswered
#1 2026-05-01 12:24:36
- mwohah
- Member
- Registered: 2017-05-31
- Posts: 69
[SOLVED] Using Sysprof to profile with Mesa and GTK markers
I'm trying to use Sysprof 50.0 from the official repositories to capture GPU-related information about Mesa as is shown in the screenshots on this article, but on the 'Markers' tab, I can only get markers from GNOME shell itself to show up when I enable the respective option before capture. Nothing related to Mesa nor GTK shows up.
I already verified the following:
Running sysprof-cli --force -- vkcube or similar doesn't log any markers related to Mesa either, nor does a 'freeform' capture of the desktop.
The libsysprof-capture package is installed.
I also tried experimenting with MESA_GPU_TRACES, but that doesn't seem to apply (?) to Sysprof, only other types of profiling/tracing.
I also did a bunch of searching on the internet and documentation pages, but all I can find are various announcements that it's been added, not really any documentation on what's necessary to use it.
I'm using an AMD iGPU with Mesa (radeonsi), perhaps it doesn't work for this driver? Or perhaps there is some undocumented environment variable I have to enable to activate this?
Last edited by mwohah (2026-05-02 09:38:56)
Offline
#2 2026-05-01 20:44:41
- Lone_Wolf
- Administrator

- From: Netherlands, Europe
- Registered: 2005-10-04
- Posts: 15,146
Re: [SOLVED] Using Sysprof to profile with Mesa and GTK markers
Did you look for markers specific to mesa like those with gallium and/or egl in their name ?
Disliking systemd intensely, but not satisfied with alternatives so focusing on taming systemd.
clean chroot building not flexible enough ?
Try clean chroot manager by graysky
Offline
#3 2026-05-02 08:24:24
- mwohah
- Member
- Registered: 2017-05-31
- Posts: 69
Re: [SOLVED] Using Sysprof to profile with Mesa and GTK markers
Thanks for the response.
I might be misunderstanding what you mean, but in the screenshots on the URL in the OP, the author is in the 'Marks' tab of Sysprof. In this tab, there are multiple headers such as 'libsoup', 'WebKit (UI)', 'GTK', 'Mesa', and more. For me, there is only 'Compositor', 'Compositor (Mutter Inpu' and 'Compositor (KMS thread)'. All of the other headings are missing - the amount of markers I have is also much lower.
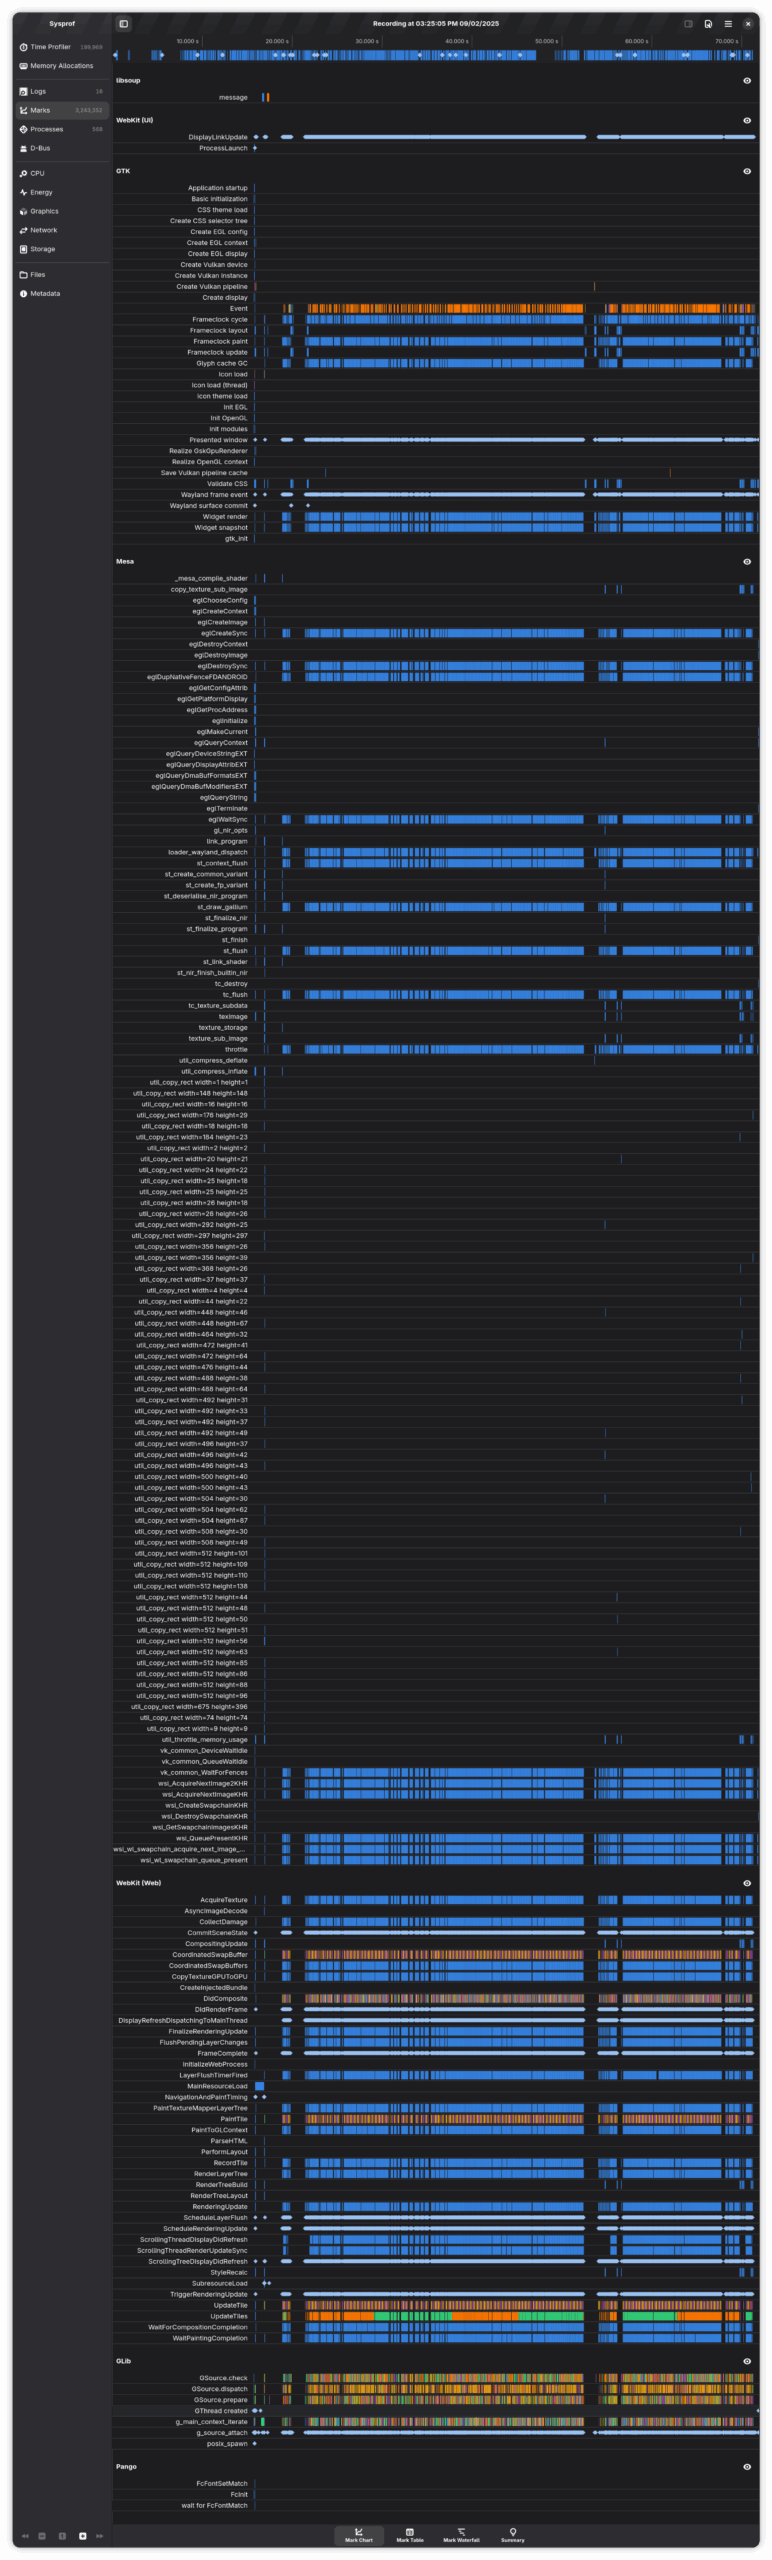
Maybe there is something else I have to click or do first after profiling to get these markers to show up, though?
From what I understand the markers are custom markers recorded by various libraries and applications, so if they are recorded they should be showing up (as is the case for mutter). It's as if the other libraries such as Mesa and GTK need some environment variable or setting set to get them to record them, but if it's documented anywhere I haven't found it.
Offline
#4 2026-05-02 09:37:21
- mwohah
- Member
- Registered: 2017-05-31
- Posts: 69
Re: [SOLVED] Using Sysprof to profile with Mesa and GTK markers
I think I figured it out. This seems to make Mesa markers show up, at least:
MESA_DEBUG=1 sysprof-cli trace.syscap --force --command=glxgearsLooks like MESA_DEBUG=1 was the thing I was missing to get Mesa markers here.
If I run a GTK application specifically, such as NewsFlash, the GTK and GLib markers also automatically show up. In the case of NewsFlash though, MESA_DEBUG doesn't seem to affect it and it doesn't record Mesa any more.
EDIT: Now it magically also works without MESA_DEBUG=1 with glxgears, I don't understand why since yesterday I had been testing extensively and couldn't get them to show up for the life of me. Sigh...
Last edited by mwohah (2026-05-02 09:38:37)
Offline