You are not logged in.
- Topics: Active | Unanswered
#1 2021-07-14 01:19:56
- Matt03
- Member

- From: Italy
- Registered: 2021-07-09
- Posts: 16
[SOLVED] Conky refreshing transparency issues
Hi, I'm having issues with Conky, when I set the
own_window_transparent = true
and
double_buffer = false
it seems like every time it refreshes the new layer is overlapping the previous one and it makes all the characters unreadable and messy. In this way 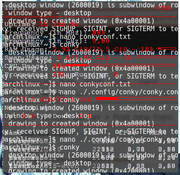
Is there a solution for this, since this problem occurs only when I have the
double_buffer = false
but if I set it to true it doesn't show me any transparent effect which is not what I want.
Last edited by Matt03 (2021-07-14 14:33:38)
Cyber Security Analyst
Offline
#2 2021-07-14 07:36:09
- seth
- Member

- From: Won't reply 2 private help req
- Registered: 2012-09-03
- Posts: 77,434
Re: [SOLVED] Conky refreshing transparency issues
The screenshot looks like soem random framebuffer segment is posted into the video (the white stuff is some shell output)
Please post the complete conky config. Do you use a compositor? Which?
Offline
#3 2021-07-14 08:45:16
- Matt03
- Member
- From: Italy
- Registered: 2021-07-09
- Posts: 16
Re: [SOLVED] Conky refreshing transparency issues
I'm using the kwin compositor.
Here is the full conky config
-- Conky, a system monitor https://github.com/brndnmtthws/conky
--
-- This configuration file is Lua code. You can write code in here, and it will
-- execute when Conky loads. You can use it to generate your own advanced
-- configurations.
--
-- Try this (remove the `--`):
--
--   print("Loading Conky config")
--
-- For more on Lua, see:
-- https://www.lua.org/pil/contents.html

conky.config = {
    alignment = 'top_left',
    background = false,
    border_width = 1,
    cpu_avg_samples = 2,
    default_color = 'white',
    default_outline_color = 'white',
    default_shade_color = 'white',
    double_buffer = false,
    draw_borders = false,
    draw_graph_borders = true,
    draw_outline = false,
    draw_shades = false,
    extra_newline = false,
    font = 'DejaVu Sans Mono:size=12',
    gap_x = 60,
    gap_y = 60,
    minimum_height = 5,
    minimum_width = 5,
    net_avg_samples = 2,
    no_buffers = true,
    out_to_console = false,
    out_to_ncurses = false,
    out_to_stderr = false,
    out_to_x = true,
    own_window = true,
    own_window_class = 'Conky',
    own_window_type = 'desktop',
    own_window_transparent = true,
    show_graph_range = false,
    show_graph_scale = false,
    stippled_borders = 0,
    update_interval = 1.0,
    uppercase = false,
    use_spacer = 'none',
    use_xft = true,
    xftalpha = 0.9,
}

conky.text = [[
${color grey}Info:$color ${scroll 32 Conky $conky_version - $sysname $nodename $kernel $machine}
$hr
${color grey}Uptime:$color $uptime
${color grey}Frequency (in MHz):$color $freq
${color grey}Frequency (in GHz):$color $freq_g
${color grey}RAM Usage:$color $mem/$memmax - $memperc% ${membar 4}
${color grey}Swap Usage:$color $swap/$swapmax - $swapperc% ${swapbar 4}
${color grey}CPU Usage:$color $cpu% ${cpubar 4}
${color grey}Processes:$color $processes  ${color grey}Running:$color $running_processes
$hr
${color grey}File systems:
 / $color${fs_used /}/${fs_size /} ${fs_bar 6 /}
${color grey}Networking:
Up:$color ${upspeed} ${color grey} - Down:$color ${downspeed}
$hr
${color grey}Name              PID     CPU%   MEM%
${color lightgrey} ${top name 1} ${top pid 1} ${top cpu 1} ${top mem 1}
${color lightgrey} ${top name 2} ${top pid 2} ${top cpu 2} ${top mem 2}
${color lightgrey} ${top name 3} ${top pid 3} ${top cpu 3} ${top mem 3}
${color lightgrey} ${top name 4} ${top pid 4} ${top cpu 4} ${top mem 4}
]]
Cyber Security Analyst
Offline
#4 2021-07-14 09:24:37
- kermit63
- Member
- Registered: 2018-07-04
- Posts: 372
Re: [SOLVED] Conky refreshing transparency issues
I haven't been using conky for a while so my memory may be a bit sketchy. IIRC, I had to add the following line to fix the same problem years ago:
own_window_argb_visual=trueNever argue with an idiot, they will drag you down to their level and then beat you with experience.
It is better to light a candle than curse the darkness.
A journey of a thousand miles begins with a single step.
Offline
#5 2021-07-14 10:50:58
- Matt03
- Member
- From: Italy
- Registered: 2021-07-09
- Posts: 16
Re: [SOLVED] Conky refreshing transparency issues
If I add that line the transparency disappear totally and only black background layer appears
Last edited by Matt03 (2021-07-14 10:51:27)
Cyber Security Analyst
Offline
#6 2021-07-14 10:51:45
- Matt03
- Member
- From: Italy
- Registered: 2021-07-09
- Posts: 16
Re: [SOLVED] Conky refreshing transparency issues
I haven't been using conky for a while so my memory may be a bit sketchy. IIRC, I had to add the following line to fix the same problem years ago:
own_window_argb_visual=true
If I add that line the transparency disappear totally and only black background layer appears
Cyber Security Analyst
Offline
#7 2021-07-14 11:26:40
- d_fajardo
- Member
- Registered: 2017-07-28
- Posts: 1,687
Re: [SOLVED] Conky refreshing transparency issues
I've copied my conky window settings. This works in my system without problem, transparency and all. I'm also in kwin. Feel free to try:
    -- Window Specifications --
    own_window_class='Conky',
    own_window=true,
    own_window_type='normal',
    own_window_transparent=true,
    own_window_hints='undecorated,below,sticky,skip_taskbar,skip_pager',
    own_window_argb_visual=true,
Offline
#8 2021-07-14 11:34:30
- seth
- Member
- From: Won't reply 2 private help req
- Registered: 2012-09-03
- Posts: 77,434
Re: [SOLVED] Conky refreshing transparency issues
Because you're not using a compositor (check "qdbus org.kde.KWin /KWin supportInformation")
Without that, the "fake" transparency operates on the root window pixmap which is likely unset (because plasma uses a desktop window)
Try
feh --bg-fill /path/to/wallpaper.jpgand activate double buffering.
Alternatively go for the argb window for "real" transparency, but that requires an active compositor.
Offline
#9 2021-07-14 11:37:07
- Matt03
- Member
- From: Italy
- Registered: 2021-07-09
- Posts: 16
Re: [SOLVED] Conky refreshing transparency issues
Yea now the transparency works even too much ^^
I cannot almost see anything, should I set some attributes like opacity or similar?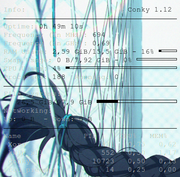
Cyber Security Analyst
Offline
#10 2021-07-14 11:54:38
- seth
- Member
- From: Won't reply 2 private help req
- Registered: 2012-09-03
- Posts: 77,434
Re: [SOLVED] Conky refreshing transparency issues
https://github.com/brndnmtthws/conky/wi … figuration
Or "own_window_color", some sample configs: https://github.com/brndnmtthws/conky/wiki/Configs
Offline
#11 2021-07-14 13:35:33
- Matt03
- Member
- From: Italy
- Registered: 2021-07-09
- Posts: 16
Re: [SOLVED] Conky refreshing transparency issues
https://github.com/brndnmtthws/conky/wi … figuration
Or "own_window_color", some sample configs: https://github.com/brndnmtthws/conky/wiki/Configs
I ended choosing this configuration https://raw.githubusercontent.com/moabd … conky.conf
It actually works but I compared it with another activity monitor and they show two different output values (e.g. RAM usage)
https://i.postimg.cc/W33qkcFw/image.png
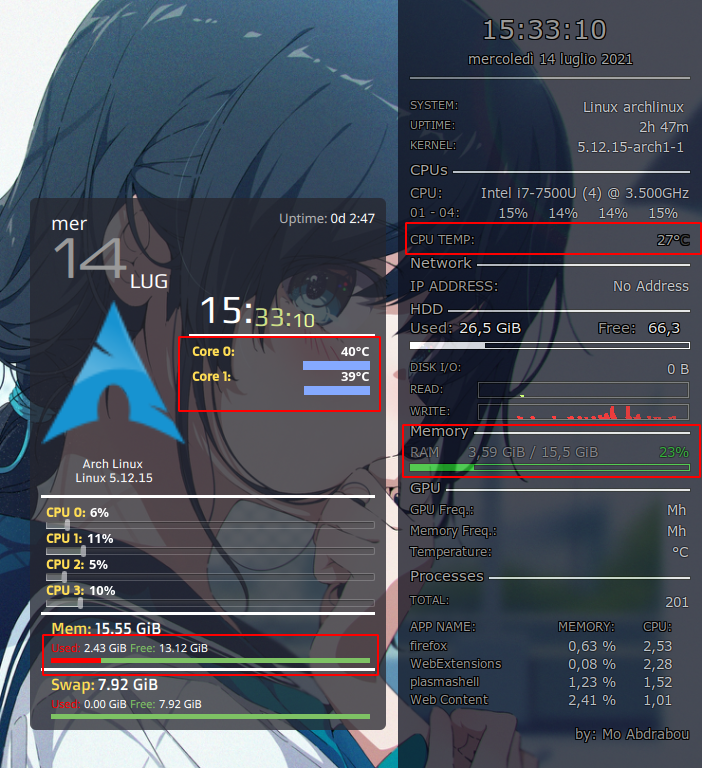
Which one is most accurate one?
And why they show so different values?
moderator edit -- replaced oversized image with link.
Pasting pictures and code
Last edited by 2ManyDogs (2021-07-14 14:18:22)
Cyber Security Analyst
Offline
#12 2021-07-14 14:04:23
- seth
- Member
- From: Won't reply 2 private help req
- Registered: 2012-09-03
- Posts: 77,434
Re: [SOLVED] Conky refreshing transparency issues
Memory is complicated - neither of them is accurate.
/proc/meminfo is accurate - at least check "free -m" which will tell you about free and available memory (what's not the same)
I assume the "cpu" temperature in conky is actually the case temperature.
The used field is "${hwmon temp N}" and the order is not deterministic - compare the output of "sensors"
Those sample configs are that: samples. Conky is very much a craft-your-own thing.
Offline
#13 2021-07-14 14:31:23
- Matt03
- Member
- From: Italy
- Registered: 2021-07-09
- Posts: 16
Re: [SOLVED] Conky refreshing transparency issues
I found how to fix the temperature using
${execi 30 sensors | grep "Core 0" | cut -d "+" -f2 | cut -c1-6}
from another discussion here in the forum https://bbs.archlinux.org/viewtopic.php?id=63974.
Btw I guess I can mark it as solved since the problem that I requested has actually been solved, now I just need to setup my config correctly
Thanks all ^^
Last edited by Matt03 (2021-07-14 14:32:08)
Cyber Security Analyst
Offline
#14 2021-07-14 14:53:59
- seth
- Member
- From: Won't reply 2 private help req
- Registered: 2012-09-03
- Posts: 77,434
Re: [SOLVED] Conky refreshing transparency issues
Don't - that's cumbersome and expensive to poll.
Just check the output of "sensors" for the interesting core(s) and use them in hwmon.
Offline
#15 2021-07-14 14:59:57
- Matt03
- Member
- From: Italy
- Registered: 2021-07-09
- Posts: 16
Re: [SOLVED] Conky refreshing transparency issues
This is my "sensors" output
coretemp-isa-0000
Adapter: ISA adapter
Package id 0:  +43.0°C  (high = +100.0°C, crit = +100.0°C)
Core 0:        +41.0°C  (high = +100.0°C, crit = +100.0°C)
Core 1:        +41.0°C  (high = +100.0°C, crit = +100.0°C)

BAT1-acpi-0
Adapter: ACPI interface
in0:          15.64 V
curr1:            N/A

pch_skylake-virtual-0
Adapter: Virtual device
temp1:        +41.0°C

acpitz-acpi-0
Adapter: ACPI interface
temp1:        +27.8°C  (crit = +119.0°C)
temp2:        +29.8°C  (crit = +119.0°C)
temp3:        +10.0°C
If I use it in
${hwmon temp N}
it shows nothing
Cyber Security Analyst
Offline
#16 2021-07-14 15:10:48
- seth
- Member
- From: Won't reply 2 private help req
- Registered: 2012-09-03
- Posts: 77,434
Re: [SOLVED] Conky refreshing transparency issues
http://conky.sourceforge.net/variables.html
"hwmon temp 1" will get you the temperature of the 1st die.
"${platform coretemp.0 temp 1}" will *likely* get you the temperature of the first core, check the path structure in /sys/devices/platform/
Offline
#17 2021-07-14 15:14:10
- Matt03
- Member
- From: Italy
- Registered: 2021-07-09
- Posts: 16
Re: [SOLVED] Conky refreshing transparency issues
This is my
tree /sys/devices/platform/coretemp.0/hwmon/hwmon4/
output
/sys/devices/platform/coretemp.0/hwmon/hwmon4/
├── device -> ../../../coretemp.0
├── name
├── power
│   ├── autosuspend_delay_ms
│   ├── control
│   ├── runtime_active_time
│   ├── runtime_status
│   └── runtime_suspended_time
├── subsystem -> ../../../../../class/hwmon
├── temp1_crit
├── temp1_crit_alarm
├── temp1_input
├── temp1_label
├── temp1_max
├── temp2_crit
├── temp2_crit_alarm
├── temp2_input
├── temp2_label
├── temp2_max
├── temp3_crit
├── temp3_crit_alarm
├── temp3_input
├── temp3_label
├── temp3_max
└── uevent
Cyber Security Analyst
Offline
#18 2021-07-14 15:23:19
- seth
- Member
- From: Won't reply 2 private help req
- Registered: 2012-09-03
- Posts: 77,434
Re: [SOLVED] Conky refreshing transparency issues
Try "${platform coretemp.0/hwmon/hwmon4 temp 1}"
Offline
#19 2021-07-14 15:24:17
- Matt03
- Member
- From: Italy
- Registered: 2021-07-09
- Posts: 16
Re: [SOLVED] Conky refreshing transparency issues
Alright.. I used
${platform coretemp.0/hwmon/hwmon4 temp 1}
and it seems it works, now I just want to fix the correct RAM usage value
Cyber Security Analyst
Offline
#20 2021-07-14 15:28:36
- seth
- Member
- From: Won't reply 2 private help req
- Registered: 2012-09-03
- Posts: 77,434
Re: [SOLVED] Conky refreshing transparency issues
Again: "correct" is subjective here.
What are you interested in?
The memory not being used at all?
The memory that you can use if you need it? (Gonna be more than the free one)
With swap? Without swap?
Is the file/inode cache part of the used memory?
Memory management is rather complicated - you cannot reasonably aggregate that in a fancy number (which is why all those indicators are quite frankly wortless itr. At best they provide you a relative trend for a specific view on the memory or you just list all possible values)
Offline
#21 2021-07-14 15:34:04
- Matt03
- Member
- From: Italy
- Registered: 2021-07-09
- Posts: 16
Re: [SOLVED] Conky refreshing transparency issues
I just want to show up the "correct" amount of RAM currently used out of the total one, fetching this value from "free -h" or from "/proc/meminfo"
Cyber Security Analyst
Offline
#22 2021-07-14 15:39:27
- seth
- Member
- From: Won't reply 2 private help req
- Registered: 2012-09-03
- Posts: 77,434
Re: [SOLVED] Conky refreshing transparency issues
You're probably getting that.
See the link I posted before, the difference is (most likely) between memeasyfree and memfree.
Offline
#23 2021-07-14 16:56:46
- Matt03
- Member
- From: Italy
- Registered: 2021-07-09
- Posts: 16
Re: [SOLVED] Conky refreshing transparency issues
I did by following this issue about RAM calculation accuracy https://github.com/brndnmtthws/conky/issues/995
Cyber Security Analyst
Offline