You are not logged in.
- Topics: Active | Unanswered
#1 2022-10-11 16:00:58
- tekstryder
- Member

- Registered: 2013-02-14
- Posts: 573
[SOLVED] Curiosity: Short systemd critical-chain
Note: I have no known issues with my system. I'm only curious if there's a simple explanation I'm overlooking.
Each time I see the output of systemd-analyze critical-chain posted by other users it's far lengthier than my own, giving me a complex.
systemd-analyze critical-chain:
graphical.target @9.443s
└─gdm.service @9.437s +6ms
  └─systemd-user-sessions.service @9.433s +2ms
    └─nss-user-lookup.target @9.445s
systemd-analyze:
Startup finished in 14.455s (firmware) + 7.360s (loader) + 1.593s (kernel) + 999ms (initrd) + 9.548s (userspace) = 33.957s
graphical.target reached after 9.443s in userspace.
When I output the plot image all looks as expected:
https://i.postimg.cc/3N23Gt1Y/boot.png
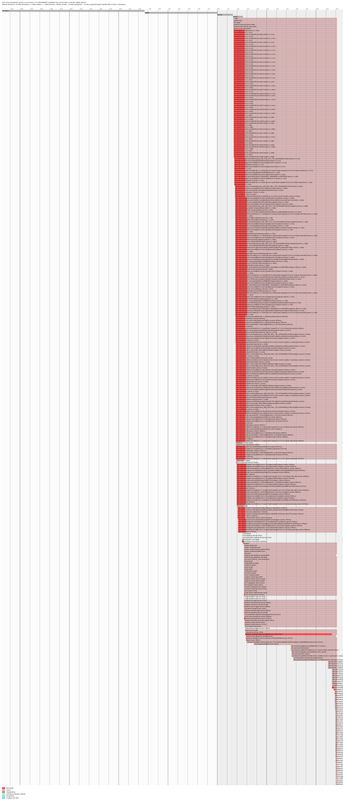
Question: Is my critical chain shorter than most but still totally normal?
Last edited by tekstryder (2022-10-11 16:25:58)
Offline
#2 2022-10-11 16:12:31
- Trilby
- Inspector Parrot

- Registered: 2011-11-29
- Posts: 30,480
- Website
Re: [SOLVED] Curiosity: Short systemd critical-chain
Question: Is my critical chain shorter than most...
I don't know who "most" is, but yours seems pretty long to me! ![]()
$ systemd-analyze critical-chain
The time when unit became active or started is printed after the "@" character.
The time the unit took to start is printed after the "+" character.

graphical.target @2.073s
└─multi-user.target @2.073s
  └─getty.target @2.073s
"UNIX is simple and coherent" - Dennis Ritchie; "GNU's Not Unix" - Richard Stallman
Offline
#3 2022-10-11 16:25:32
- tekstryder
- Member
- Registered: 2013-02-14
- Posts: 573
Re: [SOLVED] Curiosity: Short systemd critical-chain
tekstryder wrote:Question: Is my critical chain shorter than most...
I don't know who "most" is, but yours seems pretty long to me!
@Trilby, thanks for the confidence booster! Needlessly worrying about such things is far too common I suppose.
Offline