You are not logged in.
- Topics: Active | Unanswered
Pages: 1
#1 2010-06-08 13:45:11
- aze489
- Member
- Registered: 2009-12-23
- Posts: 19
High memory usage
Hello,
Since a few month, i have a really annoying problem with my system.
Memory usage increase gradually up to the point where i have to reboot because memory is constantly swapping and my system is very slow.
I used to never shutdown my computer. I had an uptime of 30/40 days. Now, i'm lucky if i reach a week of uptime before i have to reboot.
Even when i close Xorg and every daemon i can think of, memory usage is still really high, and ps aux doesn't show the process responsible for this.
I use gnome as desktop environment. I have a radeon card with KMS enabled and i use ndiswrapper for my wifi card.
Here is the output of some commands after 3 days of uptime:
free:
             total       used       free     shared    buffers     cached
Mem:       1028728     957372      71356          0      25876      75928
-/+ buffers/cache:     855568     173160
Swap:      2714944      58068    2656876

vmstat:
procs -----------memory---------- ---swap-- -----io---- -system-- ----cpu----
 r  b   swpd   free   buff  cache   si   so    bi    bo   in   cs us sy id wa
 0  0  57868  61872  28040  80640   22   21    64    58    7   17  8  2 84  5
When i close Xorg, i still get surprisingly high numbers:
free:
             total       used       free     shared    buffers     cached
Mem:       1028728     658684     370044          0      24388     100168
-/+ buffers/cache:     534128     494600
Swap:      2714944      43084    2671860

vmstat:
procs -----------memory---------- ---swap-- -----io---- -system-- ----cpu----
 r  b   swpd   free   buff  cache   si   so    bi    bo   in   cs us sy id wa
 0  0  43084 369904  24404 100280   22   21    64    58    6   17  8  2 84  5
And i can't seems to find the process responsible for this with ps, which is weird:
note: i removed all the kthreads
USER       PID %CPU %MEM    VSZ   RSS TTY      STAT START   TIME COMMAND
root         1  0.0  0.0   1708   124 ?        Ss   Jun02   0:02 init [3]
root       715  0.0  0.0   2116   276 ?        S<s  Jun02   0:00 /sbin/udevd --daemon
root      1481  0.0  0.0   2944   632 ?        Ss   Jun02   0:19 /sbin/mount.ntfs-3g /dev/sda5 /media/somedir -o rw,noexec,nosuid,nodev,users,uid=1000,gid=100,fmask=0113,dmask=0002
root      1724  0.0  0.0   5028    28 ?        S    Jun02   0:00 supervising syslog-ng
root      1725  0.0  0.0   5340   620 ?        Ss   Jun02   0:00 /usr/sbin/syslog-ng
root      1786  0.0  0.0   4880    60 ?        Ss   Jun02   0:00 wpa_supplicant -B -P /var/run/wpa_supplicant_wlan0.pid -i wlan0 -D wext -c /tmp/wpa.wlan0/wpa.conf
root      1865  0.0  0.0   1756   256 ?        Ss   Jun02   0:00 /usr/sbin/crond -S -l info
dbus      1875  0.0  0.0   2644   776 ?        Ss   Jun02   0:01 /usr/bin/dbus-daemon --system
hal       1883  0.0  0.1  14868  1140 ?        Ssl  Jun02   0:02 /usr/sbin/hald
root      1884  0.0  0.0   3456    72 ?        S    Jun02   0:00 hald-runner
root      1907  0.0  0.0   3520   264 ?        S    Jun02   0:03 hald-addon-input: Listening on /dev/input/event1 /dev/input/event6 /dev/input/event3 /dev/input/event4
root      1924  0.0  0.0   3520   224 ?        S    Jun02   0:52 hald-addon-storage: polling /dev/sr0 (every 2 sec)
hal       1926  0.0  0.0   3184    72 ?        S    Jun02   0:00 hald-addon-acpi: listening on acpi kernel interface /proc/acpi/event
root      1939  0.0  0.0   1708    60 tty1     Ss+  Jun02   0:00 /sbin/agetty -8 38400 tty1 linux
root      1940  0.0  0.0   1708    60 tty2     Ss+  Jun02   0:00 /sbin/agetty -8 38400 tty2 linux
root      1941  0.0  0.0   1708    60 tty3     Ss+  Jun02   0:00 /sbin/agetty -8 38400 tty3 linux
root      1942  0.0  0.0   1708    60 tty4     Ss+  Jun02   0:00 /sbin/agetty -8 38400 tty4 linux
root      1944  0.0  0.0   2404    64 tty6     Ss   Jun02   0:00 /bin/login --
ntp       1952  0.0  0.0   3384   276 ?        S    Jun02   0:00 /usr/sbin/ntpd -s
root      1953  0.0  0.0   3492    92 ?        Ss   Jun02   0:00 /usr/sbin/ntpd -s
1000      1965  0.0  0.1   6328  1680 tty6     S    Jun02   0:00 -bash
root      2023  0.0  0.1  18516  1644 ?        Sl   Jun02   0:00 /usr/sbin/console-kit-daemon --no-daemon
root      2103  0.0  0.0   5192   936 ?        S    Jun02   0:00 /usr/lib/upower/upowerd
root      2148  0.0  0.1  13452  1288 ?        Sl   Jun02   0:00 /usr/lib/udisks/udisks-daemon
root      2149  0.0  0.0   4940   200 ?        S    Jun02   0:27 udisks-daemon: polling /dev/sr0
root      2183  0.0  0.1   5672  1436 ?        S    Jun02   0:00 /usr/lib/polkit-1/polkitd
root      2573  0.1  0.0   5064   352 ?        Ss   Jun02   5:50 /sbin/mount.ntfs-3g /dev/sda1 /media/somedir2 -o rw,noauto,uid=1000,gid=100,fmask=0113,dmask=0002
1000      3424  0.0  0.0      0     0 pts/3    Z+   21:06   0:00 [python] <defunct>
1000      3487  0.0  0.1   4308  1044 tty6     R+   21:13   0:00 ps aux
root     14853  0.0  0.0   1708    84 tty5     Ss+  12:31   0:00 /sbin/agetty -8 38400 tty5 linux
root     15356  0.0  0.0   4748   724 ?        Ss   12:42   0:00 SCREEN -RaAdU weechat
1000     15357  0.0  0.0   6340    92 pts/3    Ss   12:42   0:00 /bin/bash
1000     15386  0.1  0.5  46632  5200 pts/3    Sl+  12:42   0:46 weechat-curses
root     17268  0.0  0.0      0     0 ?        S    Jun04   0:00 [kstriped]
root     17283  0.0  0.0   2112   412 ?        S<   Jun04   0:00 /sbin/udevd --daemon
root     17288  0.0  0.0   2112    60 ?        S<   Jun04   0:00 /sbin/udevd --daemon
As a comparison, here is what i get after a reboot:
without Xorg:
             total       used       free     shared    buffers     cached
Mem:       1028728     102072     926656          0      24352      35024
-/+ buffers/cache:      42696     986032
Swap:      2714944          0    2714944

procs -----------memory---------- ---swap-- -----io---- -system-- ----cpu----
 r  b   swpd   free   buff  cache   si   so    bi    bo   in   cs us sy id wa
 0  0      0 926544  24388  35144    0    0   374    19  125  199  1  2 88 10

with Xorg:
             total       used       free     shared    buffers     cached
Mem:       1028728     626636     402092          0      58428     209044
-/+ buffers/cache:     359164     669564
Swap:      2714944          0    2714944

procs -----------memory---------- ---swap-- -----io---- -system-- ----cpu----
 r  b   swpd   free   buff  cache   si   so    bi    bo   in   cs us sy id wa
 0  0      0 402124  58452 209072    0    0   599    35  743  660  8  3 73 16
I would really appreciate any idea on how to find the cause of my problem.
aze489
Offline
#2 2010-06-08 14:06:58
- nfm
- Member

- Registered: 2008-06-13
- Posts: 66
Re: High memory usage
Can your try installing 2.6.32 kernel, the lts one? Ever since 2.6.33 my memory usage went 200%~300% on all of my machines ![]() , I can't bisect it either since I get oopses and traces.
, I can't bisect it either since I get oopses and traces.
Offline
#3 2010-06-08 14:07:34
- ijanos
- Member

- From: Budapest, Hungary
- Registered: 2008-03-30
- Posts: 443
Re: High memory usage
First, you could use the -m switch of free to show megabytes.
Also please use top or htop (preferred) and sort the processes by memory usage (press shift-m) and show us the top 5.
Did you ever tinker with the vm.swappines value?
Offline
#4 2010-06-08 14:34:45
- aze489
- Member
- Registered: 2009-12-23
- Posts: 19
Re: High memory usage
First, you could use the -m switch of free to show megabytes.
Also please use top or htop (preferred) and sort the processes by memory usage (press shift-m) and show us the top 5.
Did you ever tinker with the vm.swappines value?
I don't think using top would give me any more relevant information, but i will try it next time (i had to reboot today).
And no, i never modified the vm.swappiness value. It's at 60 right now.
Can your try installing 2.6.32 kernel, the lts one? Ever since 2.6.33 my memory usage went 200%~300% on all of my machines
, I can't bisect it either since I get oopses and traces.
No, i haven't tried, but i will. Do you know if other people are experiencing the same kind of problems with the 2.6.33 kernel ?
Last edited by aze489 (2010-06-08 14:38:05)
Offline
#5 2010-06-08 15:38:48
- Vamp898
- Member

- From: 東京
- Registered: 2009-01-03
- Posts: 912
- Website
Re: High memory usage
The cause of your problem is the memory management of Linux. This used Memory gets free if a other application needs it. If not it will be clogged.
If you want to free it, write a BASH Skript which just blows the memory so it will get freed. This will make your system maybe a bit slower but you need less memory. It seems like that is what you want.
Offline
#6 2010-06-08 16:35:56
- theDOC
- Member
- From: Aachen, Germany
- Registered: 2009-06-18
- Posts: 50
Re: High memory usage
Do you use Xorg 1.8 by any chance? Last time I tried, it had a huge memory leak on my computer. Eating up like 500mb or sth., after a couple of days.
And, can you post a ps dump from when the actual massive swapping is happening? Memory not showing up in "free" doesn't mean that newly opened programs cannot use it.
Offline
#7 2010-06-08 17:11:01
- aze489
- Member
- Registered: 2009-12-23
- Posts: 19
Re: High memory usage
The cause of your problem is the memory management of Linux. This used Memory gets free if a other application needs it. If not it will be clogged.
If you want to free it, write a BASH Skript which just blows the memory so it will get freed. This will make your system maybe a bit slower but you need less memory. It seems like that is what you want.
I use Arch since january 2009 and i never had this problem until a few months ago. After a few days on, memory usage on my computer is over 950mb (i have 1gb of ram), swap at 300mb.
When i focus a window, i have to wait 20 seconds before it appears, and i can hear my hdd working.
I wouldn't consider that a "normal" behaviour ![]()
Do you use Xorg 1.8 by any chance? Last time I tried, it had a huge memory leak on my computer. Eating up like 500mb or sth., after a couple of days.
And, can you post a ps dump from when the actual massive swapping is happening? Memory not showing up in "free" doesn't mean that newly opened programs cannot use it.
I'm using xorg 1.7.6.
the ps dump:
USER       PID %CPU %MEM    VSZ   RSS TTY      STAT START   TIME COMMAND
root         1  0.0  0.0   1708   176 ?        Ss   Jun02   0:02 init [3]
root         2  0.0  0.0      0     0 ?        S    Jun02   0:00 [kthreadd]
root         3  0.0  0.0      0     0 ?        S    Jun02   0:00 [migration/0]
root         4  0.0  0.0      0     0 ?        S    Jun02   0:03 [ksoftirqd/0]
root         5  0.0  0.0      0     0 ?        S    Jun02   0:00 [watchdog/0]
root         6  0.0  0.0      0     0 ?        S    Jun02   0:00 [migration/1]
root         7  0.0  0.0      0     0 ?        S    Jun02   0:04 [ksoftirqd/1]
root         8  0.0  0.0      0     0 ?        S    Jun02   0:00 [watchdog/1]
root         9  0.0  0.0      0     0 ?        S    Jun02   0:31 [events/0]
root        10  0.0  0.0      0     0 ?        S    Jun02   0:31 [events/1]
root        11  0.0  0.0      0     0 ?        S    Jun02   0:00 [cpuset]
root        12  0.0  0.0      0     0 ?        S    Jun02   0:00 [khelper]
root        13  0.0  0.0      0     0 ?        S    Jun02   0:00 [netns]
root        14  0.0  0.0      0     0 ?        S    Jun02   0:00 [async/mgr]
root        15  0.0  0.0      0     0 ?        S    Jun02   0:00 [pm]
root        16  0.0  0.0      0     0 ?        S    Jun02   0:00 [sync_supers]
root        17  0.0  0.0      0     0 ?        S    Jun02   0:00 [bdi-default]
root        18  0.0  0.0      0     0 ?        S    Jun02   0:01 [kblockd/0]
root        19  0.0  0.0      0     0 ?        S    Jun02   0:08 [kblockd/1]
root        20  0.0  0.0      0     0 ?        S    Jun02   0:00 [kacpid]
root        21  0.0  0.0      0     0 ?        S    Jun02   0:00 [kacpi_notify]
root        22  0.0  0.0      0     0 ?        S    Jun02   0:00 [kacpi_hotplug]
root        23  0.0  0.0      0     0 ?        S    Jun02   0:00 [kseriod]
root        26  0.0  0.0      0     0 ?        S    Jun02   0:00 [khungtaskd]
root        27  0.0  0.0      0     0 ?        S    Jun02   1:26 [kswapd0]
root        28  0.0  0.0      0     0 ?        SN   Jun02   0:00 [ksmd]
root        29  0.0  0.0      0     0 ?        S    Jun02   0:00 [aio/0]
root        30  0.0  0.0      0     0 ?        S    Jun02   0:00 [aio/1]
root        31  0.0  0.0      0     0 ?        S    Jun02   0:00 [crypto/0]
root        32  0.0  0.0      0     0 ?        S    Jun02   0:00 [crypto/1]
root       573  0.0  0.0      0     0 ?        S    Jun02   0:07 [ata/0]
root       587  0.0  0.0      0     0 ?        S    Jun02   0:27 [ata/1]
root       601  0.0  0.0      0     0 ?        S    Jun02   0:00 [ata_aux]
root       618  0.0  0.0      0     0 ?        S    Jun02   0:00 [scsi_eh_0]
root       622  0.0  0.0      0     0 ?        S    Jun02   0:00 [scsi_eh_1]
root       626  0.0  0.0      0     0 ?        S    Jun02   0:00 [scsi_eh_2]
root       628  0.0  0.0      0     0 ?        S    Jun02   1:06 [scsi_eh_3]
root       645  0.0  0.0      0     0 ?        S    Jun02   0:00 [scsi_eh_4]
root       649  0.0  0.0      0     0 ?        S    Jun02   0:00 [scsi_eh_5]
root       680  0.0  0.0      0     0 ?        S    Jun02   0:03 [jbd2/sda7-8]
root       681  0.0  0.0      0     0 ?        S    Jun02   0:00 [ext4-dio-unwrit]
root       682  0.0  0.0      0     0 ?        S    Jun02   0:00 [ext4-dio-unwrit]
root       715  0.0  0.0   2116   276 ?        S<s  Jun02   0:00 /sbin/udevd --daemon
root       881  0.0  0.0      0     0 ?        S    Jun02   0:00 [kgameportd]
root      1067  0.0  0.0      0     0 ?        S    Jun02   0:00 [ksuspend_usbd]
root      1074  0.0  0.0      0     0 ?        S    Jun02   0:00 [khubd]
root      1121  0.6  0.0      0     0 ?        S    Jun02  28:47 [ntos_wq]
root      1122  0.0  0.0      0     0 ?        S    Jun02   0:00 [ndis_wq]
root      1123  0.2  0.0      0     0 ?        S    Jun02  11:46 [wrapndis_wq]
root      1138  0.0  0.0      0     0 ?        S    Jun02   0:00 [radeon/0]
root      1140  0.0  0.0      0     0 ?        S    Jun02   0:00 [radeon/1]
root      1143  0.0  0.0      0     0 ?        S    Jun02   0:00 [ttm_swap]
root      1377  0.0  0.0      0     0 ?        S    Jun02   0:00 [usbhid_resumer]
root      1463  0.0  0.0      0     0 ?        S    Jun02   0:28 [flush-8:0]
root      1469  0.0  0.0      0     0 ?        S    Jun02   0:11 [jbd2/sda8-8]
root      1470  0.0  0.0      0     0 ?        S    Jun02   0:00 [ext4-dio-unwrit]
root      1471  0.0  0.0      0     0 ?        S    Jun02   0:00 [ext4-dio-unwrit]
root      1472  0.0  0.0      0     0 ?        S    Jun02   0:00 [jbd2/sda6-8]
root      1473  0.0  0.0      0     0 ?        S    Jun02   0:00 [ext4-dio-unwrit]
root      1474  0.0  0.0      0     0 ?        S    Jun02   0:00 [ext4-dio-unwrit]
root      1481  0.0  0.0   2944   608 ?        Ss   Jun02   0:19 /sbin/mount.ntfs-3g /dev/sda5 /media/somedir -o rw,noexec,nosuid,nodev,users,uid=1000,gid=100,fmask=0113,dmask=0002
root      1724  0.0  0.0   5028    28 ?        S    Jun02   0:00 supervising syslog-ng
root      1725  0.0  0.0   5340   568 ?        Ss   Jun02   0:00 /usr/sbin/syslog-ng
root      1786  0.0  0.0   4880    60 ?        Ss   Jun02   0:00 wpa_supplicant -B -P /var/run/wpa_supplicant_wlan0.pid -i wlan0 -D wext -c /tmp/wpa.wlan0/wpa.conf
root      1865  0.0  0.0   1756   256 ?        Ss   Jun02   0:00 /usr/sbin/crond -S -l info
dbus      1875  0.0  0.0   2644   704 ?        Ss   Jun02   0:01 /usr/bin/dbus-daemon --system
hal       1883  0.0  0.1  14868  1196 ?        Ssl  Jun02   0:02 /usr/sbin/hald
root      1884  0.0  0.0   3456    72 ?        S    Jun02   0:00 hald-runner
root      1907  0.0  0.0   3520   264 ?        S    Jun02   0:03 hald-addon-input: Listening on /dev/input/event1 /dev/input/event6 /dev/input/event3 /dev/input/event4
root      1924  0.0  0.0   3520   224 ?        S    Jun02   0:52 hald-addon-storage: polling /dev/sr0 (every 2 sec)
hal       1926  0.0  0.0   3184    72 ?        S    Jun02   0:00 hald-addon-acpi: listening on acpi kernel interface /proc/acpi/event
root      1939  0.0  0.0   1708    60 tty1     Ss+  Jun02   0:00 /sbin/agetty -8 38400 tty1 linux
root      1940  0.0  0.0   1708    60 tty2     Ss+  Jun02   0:00 /sbin/agetty -8 38400 tty2 linux
root      1941  0.0  0.0   1708    60 tty3     Ss+  Jun02   0:00 /sbin/agetty -8 38400 tty3 linux
root      1942  0.0  0.0   1708    60 tty4     Ss+  Jun02   0:00 /sbin/agetty -8 38400 tty4 linux
ntp       1952  0.0  0.0   3384   272 ?        S    Jun02   0:00 /usr/sbin/ntpd -s
root      1953  0.0  0.0   3492    80 ?        Ss   Jun02   0:00 /usr/sbin/ntpd -s
root      2023  0.0  0.1  18516  1688 ?        Sl   Jun02   0:00 /usr/sbin/console-kit-daemon --no-daemon
root      2103  0.0  0.0   5192  1008 ?        S    Jun02   0:00 /usr/lib/upower/upowerd
root      2148  0.0  0.1  13452  1356 ?        Sl   Jun02   0:00 /usr/lib/udisks/udisks-daemon
root      2149  0.0  0.0   4940   200 ?        S    Jun02   0:27 udisks-daemon: polling /dev/sr0
root      2183  0.0  0.1   5672  1564 ?        S    Jun02   0:00 /usr/lib/polkit-1/polkitd
root      2573  0.1  0.0   5064   524 ?        Ss   Jun02   5:50 /sbin/mount.ntfs-3g /dev/sda1 /media/someotherdir -o rw,noauto,uid=1000,gid=100,fmask=0113,dmask=0002
1000      3424  0.0  0.0      0     0 pts/3    Z+   21:06   0:00 [python] <defunct>
root      3489  0.0  0.0   2404   916 tty6     Ss   21:13   0:00 /bin/login --
1000      3490  0.0  0.2   6328  2920 tty6     S    21:13   0:00 -bash
1000      3525  0.0  0.1   4936  1360 tty6     S+   21:13   0:00 /bin/sh /usr/bin/startx
1000      3542  0.0  0.0   2968   788 tty6     S+   21:13   0:00 xinit /home/me/.xinitrc -- /etc/X11/xinit/xserverrc :0 -auth /tmp/serverauth.0eQfIqbk10
root      3543  4.1  2.2  36624 23468 tty8     S<s+ 21:13   0:08 /usr/bin/X -nolisten tcp
1000      3547  0.0  0.0   2068   696 tty6     S    21:13   0:00 ck-launch-session gnome-session
1000      3556  0.0  0.6  28288  7080 tty6     Sl   21:13   0:00 gnome-session
1000      3559  0.0  0.0   3128   700 tty6     S    21:13   0:00 dbus-launch --exit-with-session gnome-session
1000      3560  0.0  0.1   2704  1308 ?        Ss   21:13   0:00 /usr/bin/dbus-daemon --fork --print-pid 5 --print-address 7 --session
1000      3563  0.1  0.3   8028  4036 ?        S    21:13   0:00 /usr/lib/GConf/gconfd-2
1000      3570  0.4  1.3  29008 14328 ?        Ss   21:13   0:01 /usr/bin/gnome-settings-daemon
1000      3571  0.0  0.1  24088  1976 tty6     Sl   21:13   0:00 gnome-keyring-daemon --start --components=secrets
1000      3575  0.0  0.2   6760  2156 ?        S    21:13   0:00 /usr/lib/gvfs/gvfsd
1000      3580  1.2  1.2  25192 12536 tty6     S    21:13   0:02 metacity
1000      3583  0.0  0.2  29932  2300 ?        Ssl  21:13   0:00 /usr/lib/gvfs//gvfs-fuse-daemon /home/me/.gvfs
1000      3587  0.7  2.9  97252 30696 tty6     S    21:13   0:01 gnome-panel
1000      3590  0.0  0.3  42368  3412 ?        S    21:13   0:00 /usr/lib/gvfs/gvfs-gdu-volume-monitor
1000      3591  1.9  2.5 125740 26348 tty6     Sl   21:13   0:04 nautilus
1000      3593  0.0  0.3  42408  3360 ?        Ssl  21:13   0:00 /usr/lib/bonobo/bonobo-activation-server --ac-activate --ior-output-fd=18
1000      3602  0.0  1.0  35868 10424 tty6     S    21:13   0:00 evolution-alarm-notify
1000      3603  0.0  0.7  21568  7560 tty6     S    21:13   0:00 /usr/lib/gnome-disk-utility/gdu-notification-daemon
1000      3605  0.0  0.5  19340  6112 tty6     S    21:13   0:00 /usr/lib/polkit-gnome/polkit-gnome-authentication-agent-1
1000      3609  0.5  1.2  78108 13232 ?        S    21:13   0:01 /usr/lib/gnome-panel/wnck-applet --oaf-activate-iid=OAFIID:GNOME_Wncklet_Factory --oaf-ior-fd=18
1000      3618  0.0  1.2  88556 12408 ?        Sl   21:13   0:00 /usr/lib/gnome-applets/mixer_applet2 --oaf-activate-iid=OAFIID:GNOME_MixerApplet_Factory --oaf-ior-fd=27
1000      3619  0.0  0.8  24616  9172 ?        S    21:13   0:00 /usr/lib/gnome-panel/notification-area-applet --oaf-activate-iid=OAFIID:GNOME_NotificationAreaApplet_Factory --oaf-ior-fd=33
1000      3620  0.2  0.8  25012  8972 ?        S    21:13   0:00 /usr/lib/gnome-applets/multiload-applet-2 --oaf-activate-iid=OAFIID:GNOME_MultiLoadApplet_Factory --oaf-ior-fd=21
1000      3622  0.0  1.4  95028 14836 ?        S    21:13   0:00 /usr/lib/gnome-panel/clock-applet --oaf-activate-iid=OAFIID:GNOME_ClockApplet_Factory --oaf-ior-fd=30
1000      3626  0.0  0.2  20504  2620 ?        Ss   21:13   0:00 gnome-screensaver
1000      3627  0.0  0.5  34624  5960 ?        S    21:13   0:00 /usr/lib/evolution-data-server-1.2/e-calendar-factory
1000      3634  0.0  0.5  33600  5280 ?        S    21:13   0:00 /usr/lib/evolution-data-server-1.2/e-addressbook-factory
1000      3637  0.0  0.2   7212  2788 ?        S    21:13   0:00 /usr/lib/gvfs/gvfsd-trash --spawner :1.9 /org/gtk/gvfs/exec_spaw/0
1000      3642  0.0  0.2   6900  2148 ?        S    21:13   0:00 /usr/lib/gvfs/gvfsd-burn --spawner :1.9 /org/gtk/gvfs/exec_spaw/1
1000      3652  0.1  0.3   8792  3692 ?        S    21:13   0:00 /usr/lib/gvfs/gvfsd-metadata
1000      3678 16.9 17.3 422516 178932 tty6    Sl   21:15   0:21 firefox
1000      3719  1.2  3.0 124176 31268 tty6     S    21:15   0:01 pidgin
1000      3862  1.3  1.3  83544 14008 tty6     Sl   21:15   0:01 gnome-terminal
1000      3869  0.0  0.0   1752   600 tty6     S    21:15   0:00 gnome-pty-helper
1000      3871  0.2  0.3   6388  3192 pts/0    Ss   21:15   0:00 bash
1000      3907  0.1  0.3   6260  3140 pts/1    Ss   21:15   0:00 bash
1000      3968  0.0  0.0   4616   916 pts/1    S+   21:15   0:00 screen -RaAdU weechat
1000      3977  0.2  0.3   6260  3152 pts/2    Ss+  21:16   0:00 bash
1000      4017  0.0  0.1   4308  1044 pts/0    R+   21:17   0:00 ps aux
root     14853  0.0  0.0   1708    84 tty5     Ss+  12:31   0:00 /sbin/agetty -8 38400 tty5 linux
root     15356  0.0  0.0   4748   964 ?        Ss   12:42   0:00 SCREEN -RaAdU weechat
1000     15357  0.0  0.0   6340    92 pts/3    Ss   12:42   0:00 /bin/bash
1000     15386  0.1  0.3  46632  3392 pts/3    Sl+  12:42   0:46 weechat-curses
root     17268  0.0  0.0      0     0 ?        S    Jun04   0:00 [kstriped]
root     17283  0.0  0.0   2112   388 ?        S<   Jun04   0:00 /sbin/udevd --daemon
root     17288  0.0  0.0   2112    60 ?        S<   Jun04   0:00 /sbin/udevd --daemon
i posted the corresponding "free" in my first message:
             total       used       free     shared    buffers     cached
Mem:       1028728     957372      71356          0      25876      75928
-/+ buffers/cache:     855568     173160
Swap:      2714944      58068    2656876
Last edited by aze489 (2010-06-08 17:17:10)
Offline
#8 2010-06-08 17:36:57
- Vamp898
- Member
- From: 東京
- Registered: 2009-01-03
- Posts: 912
- Website
Re: High memory usage
What does happen if you turn off your swap?
Offline
#9 2010-06-08 19:01:01
- ijanos
- Member
- From: Budapest, Hungary
- Registered: 2008-03-30
- Posts: 443
Re: High memory usage
What does happen if you turn off your swap?
![]() The OOM Killer will go wild.
The OOM Killer will go wild.
Offline
#10 2010-06-08 19:06:29
- ijanos
- Member
- From: Budapest, Hungary
- Registered: 2008-03-30
- Posts: 443
Re: High memory usage
1000 3678 16.9 17.3 422516 178932 tty6 Sl 21:15 0:21 firefox
I'm useing firefox with ~15 addons and 40+ tabs but never seen it eating that much memory. You should close it somestimes, i guess the uptime of firefox itself is long too.
Offline
#11 2010-06-08 19:15:20
- Ramses de Norre
- Member

- From: Leuven - Belgium
- Registered: 2007-03-27
- Posts: 1,289
Re: High memory usage
@ijanos: really? I've got even more with 13 addons and 13 tabs open...
ramses 20398 15.9 8.2 469852 170240 ? Sl 20:25 7:34 firefoxOffline
#12 2010-06-08 19:16:00
- ijanos
- Member
- From: Budapest, Hungary
- Registered: 2008-03-30
- Posts: 443
Re: High memory usage
I use Arch since january 2009 and i never had this problem until a few months ago. After a few days on, memory usage on my computer is over 950mb (i have 1gb of ram), swap at 300mb.
When i focus a window, i have to wait 20 seconds before it appears, and i can hear my hdd working.
I wouldn't consider that a "normal" behaviour
It is not normal behavoiur. This is exactly what happens when the system runs out of memory. Increasing (!) swappines to 100 should help a little with the response times but something is definietly leaking memory.
Offline
#13 2010-06-08 19:18:25
- ijanos
- Member
- From: Budapest, Hungary
- Registered: 2008-03-30
- Posts: 443
Re: High memory usage
@ijanos: really? I've got even more with 13 addons and 13 tabs open...
ramses 20398 15.9 8.2 469852 170240 ? Sl 20:25 7:34 firefox
Well, I'm using adblock and flashblock since years i guees that decreases the number a little, but yeah mine is around 200-350 megabytes of ram.
Offline
#14 2010-06-08 19:19:44
- Ramses de Norre
- Member
- From: Leuven - Belgium
- Registered: 2007-03-27
- Posts: 1,289
Re: High memory usage
Ramses de Norre wrote:@ijanos: really? I've got even more with 13 addons and 13 tabs open...
ramses 20398 15.9 8.2 469852 170240 ? Sl 20:25 7:34 firefoxWell, I'm using adblock and flashblock since years i guees that decreases the number a little, but yeah mine is around 200-350 megabytes of ram.
adblock and noscript here... Strange.
Offline
#15 2010-06-08 19:23:13
- aze489
- Member
- Registered: 2009-12-23
- Posts: 19
Re: High memory usage
What does happen if you turn off your swap?
I don't know, i haven't tried. I will in 3 days before i reboot...
And 469852 is "virtual memory" size, it doesn't mean firefox is really using 469mb of memory, right ?
Last edited by aze489 (2010-06-08 19:34:29)
Offline
#16 2010-06-08 19:42:20
- Vamp898
- Member
- From: 東京
- Registered: 2009-01-03
- Posts: 912
- Website
Re: High memory usage
http://img694.imageshack.us/img694/9044 … tember.png
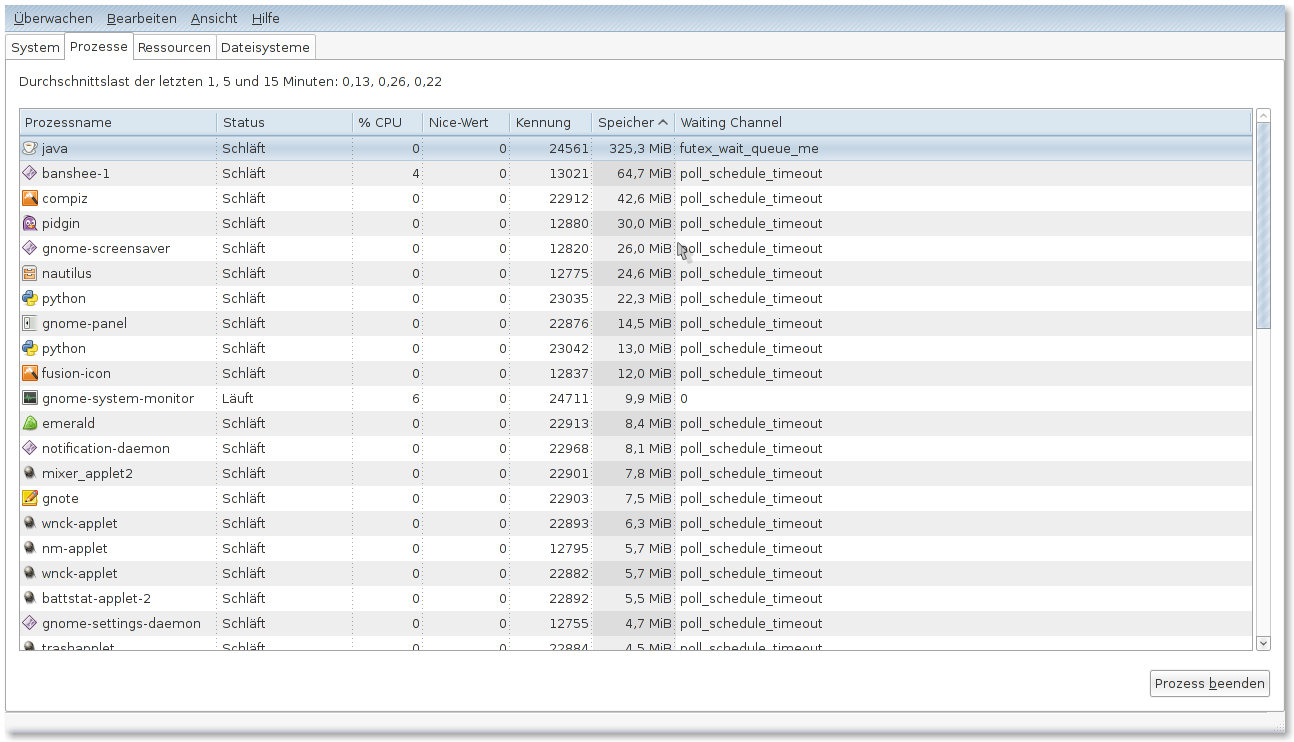
Only Java can beat Firefox xD
Offline
#17 2010-06-08 19:49:22
- ijanos
- Member
- From: Budapest, Hungary
- Registered: 2008-03-30
- Posts: 443
Re: High memory usage
And 469852 is "virtual memory" size, it doesn't mean firefox is really using 469mb of memory, right ?
Oh opps. Yeah that is right. The RSS column is closest to the real memory usage. And it is much lower.
Offline
#18 2010-09-28 10:08:34
- CptYossarian
- Member
- Registered: 2009-02-05
- Posts: 5
Re: High memory usage
Has anyone fixed this?
Offline
#19 2010-09-28 12:57:00
- karol
- Archivist
- Registered: 2009-05-06
- Posts: 25,440
Re: High memory usage
Has anyone fixed this?
Fixed what? Post your 'free -m' and how much RAM top five or top ten apps are using.
Offline
#20 2010-11-05 10:51:02
- thms
- Member
- Registered: 2010-02-01
- Posts: 120
Re: High memory usage
Sorry for hijacking this thread but I'm sitting in front of an unresponsive system very often due to high memory/swap usage.
Currently the usage is low but very often X uses much more memory:
$ free -m
             total       used       free     shared    buffers     cached
Mem:          1991       1122        868          0          4        244
-/+ buffers/cache:        873       1117
Swap:         1961        232       1728
Here's the top nine from top:
  PID USER      PR  NI  VIRT  RES  SHR S %CPU %MEM    TIME+  COMMAND
 3215 root      20   0  287m 173m 2332 S    6  8.7   7:21.45 X
 3909 thomas    20   0  596m 117m  10m S    0  5.9   1:03.76 thunderbird-bin
 3946 thomas    20   0  499m 116m  13m S    2  5.8   1:11.23 firefox
 3458 thomas    20   0  663m  76m  44m R   48  3.8  43:50.31 kwin
 3481 thomas    20   0  681m  34m 9164 S   10  1.7   9:23.54 plasma-desktop
 3668 thomas    39  19  198m  33m  832 S    0  1.7   1:47.61 virtuoso-t
 4128 thomas    20   0  403m  27m 4796 S    0  1.4   0:08.56 kile
 5060 thomas    20   0  406m  25m 7400 S    0  1.3   0:26.82 okular
 5084 thomas    20   0  404m  22m 7392 S    0  1.1   0:00.78 okular
I also set the swappines according to the wiki but with no success. The main problem is that I can't use VirtualBox because of this high memory usage.
Offline
#21 2010-11-05 12:55:03
- ijanos
- Member
- From: Budapest, Hungary
- Registered: 2008-03-30
- Posts: 443
Re: High memory usage
Sorry for hijacking this thread but I'm sitting in front of an unresponsive system very often due to high memory/swap usage.
...
I also set the swappines according to the wiki but with no success. The main problem is that I can't use VirtualBox because of this high memory usage.
Strange, You have plenty of free memory. I had a machine with less physical ram than what you have free right now and i've used virtualbox with acceptable speed. How exactly did you modify your swappines? It is a bit counter intuitive, but increasing it will help you make your system more responsive.
Oh, and almost forget: you can use xrestop to examine why is X taking up so much memory.
Last edited by ijanos (2010-11-05 13:11:51)
Offline
#22 2010-11-10 11:21:21
- thms
- Member
- Registered: 2010-02-01
- Posts: 120
Re: High memory usage
I used this
File: /etc/sysctl.conf
vm.swappiness=1
vm.vfs_cache_pressure=50
On another system I haven't touched these settings and have the same problem. The swapping starts even with enough free RAM e.g. when I start a virtual machine (I have 1,3M RAM free, start a virtual machine that has assigned 1GB and the swapping starts)
xrestop shows that plasma-desktop and kwin are the two a applications that cause the high amount of RAM X needs.
Offline
#23 2010-11-10 11:35:21
- ijanos
- Member
- From: Budapest, Hungary
- Registered: 2008-03-30
- Posts: 443
Re: High memory usage
Setting swappiness to 1 is generally a bad idea, it will force the kernel to only swap when it is really necessery but at that point it will have to swap a LOT. Try it with swappiness set to like 80.
and dont forget: unused ram is wasted ram ![]()
Offline
#24 2010-11-10 13:35:40
- ChoK
- Member
- From: France
- Registered: 2008-10-01
- Posts: 346
Re: High memory usage
I have 1,3M RAM free, start a virtual machine that has assigned 1GB and the swapping starts
Typo? because it's normal 1,3M is about 1000 times lower than 1GB.
you can check which libraries loaded by a process consumes the more RAM with ksysguard "detailed memory information" (or something like that). You need to be root to check X.
Also I think there is a bug in kwin or nvidia or X triggered by GPU-accelerated apps (for me usually smplayer and chromium 7.x builds) see http://code.google.com/p/chromium/issue … l?id=57782. What's your video driver?
You also may be interested in the pmap tool, which provides the same info as ksysguard (which memory range are reserved, by which library etc...)
usage: sudo pmap -d `pidof X` (you need to be root to check X)
Ah, good taste! What a dreadful thing! Taste is the enemy of creativeness.
Picasso
Perfection is reached, not when there is no longer anything to add, but when there is no longer anything to take away.
Saint Exupéry
Offline
#25 2010-11-12 14:04:20
- thms
- Member
- Registered: 2010-02-01
- Posts: 120
Re: High memory usage
Oh, yes this is a typo. It should be 1,3GB.
I'm using the nvidia drivers from the repos.
I'll definitely take a look at the tools you suggested and follow the bug report.
\edit: Don't know if it's kwin or even plasma. With 14,6% mem for X xrestop shows:
res-base Wins  GCs Fnts Pxms Misc   Pxm mem  Other   Total   PID Identifier
1a00000    69   48    0 1670 1823    38749K     45K  38794K  3473 plasma-desktop
1600000    60    1    0  461  908     8167K     22K   8190K  3446 kwin
3400000    43   12    0 1878 2018     4591K     48K   4639K  4889 amarok
I've noticed on both kde machines with nividia cards that this often occurs when working with okular a lot.
Last edited by thms (2010-11-12 15:52:09)
Offline
Pages: 1